07 Feb The Index by Numbers
Glenn Maxwell might be the top-rated player in the Index thanks to stellar performances across three years of T20 cricket but Sunil Narine is just five points behind and a host of other players are vying to reach world number one status.
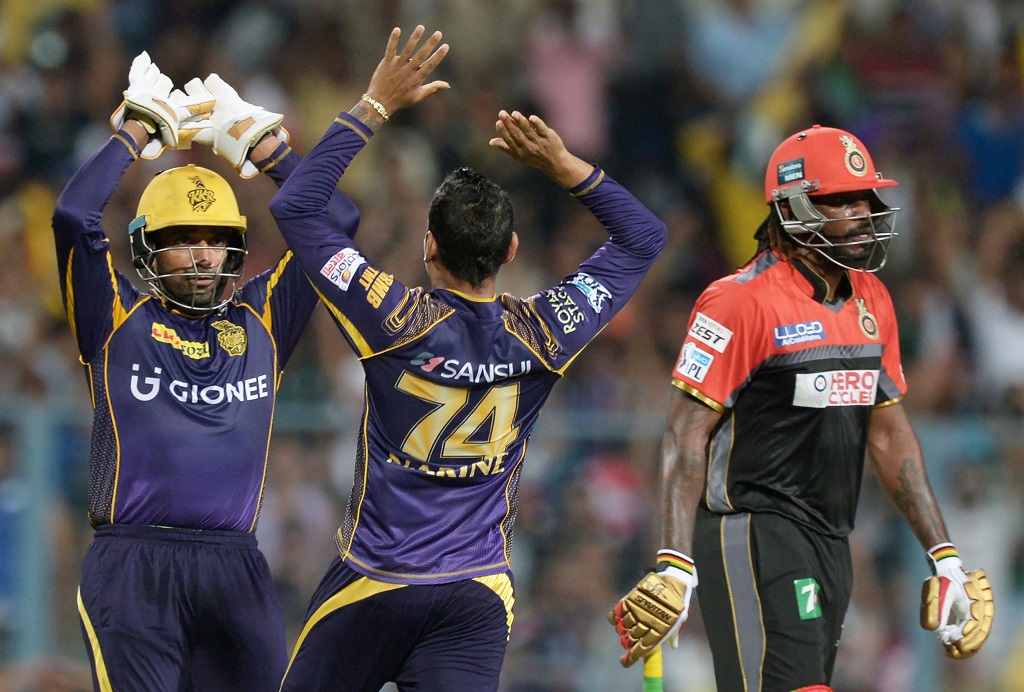
Narine boasts the second highest win rate for players who have played 100 matches or more in the Index and has scored 931 runs and taken 118 wickets in this format. He also has two tournament wins under his belt and will be looking to overhaul Maxwell in the next few weeks during the Pakistan Super League, where he will be playing for the Lahore Qalandars. Maxwell is not taking part in this year’s PSL.
The leading wicket taker in the Index is Dwayne Bravo, with 199 victims and an economy rate of 8.23. Bravo has made 1,770 runs during this period and it is no surprise to find him at number six in the Index.
In ninth place, the self-proclaimed ‘World Boss’ Chris Gayle is the Index’s leading scorer in with 4,260 runs at a strike-rate of 154, that’s just over a thousand runs more than Brendon McCullum, the second highest aggregate run scorer with 3,204 runs at 148.
Players on the move:
- Andre Russell was number 1 at the end of 2016 but having not played for almost a year, he has now fallen to 118
- One to watch – Jofra Archer is quickly climbing up the Index, having been at number 417 in October and 287 prior to the Big Bash, he now sits at number 186
- There were 15 new players appearing in the Index following this year’s Big Bash. The highest ‘new entry’ is Matthew Kelly who now sits at number 545 in the Index
- The highest climbers following the Big Bash were AJ Nair (up 795 places to 481), Peter Siddle (up 750 to 338) and Alex Carey (up 747 to 218)
International Trans-Tasman T20 Tri-Series Final
Below we have analysed the players in the most recent T20I between Australia and New Zealand – in the final of the tri-series in Auckland. The numbers suggest it was no surprise that Australia came out victorious, the combined Index standing of all their players was 935 which compared to 1562 for the Black Caps. The player highest on the Index was Glenn Maxwell, the world number 1, and the lowest was the relative novice, Kiwi keeper Tim Seifert. Interestingly, the one number where the Kiwis did come out on top was the number of players in the top 100, eight to the Australians’ six.
| New Zealand | Standing | Australia | Standing | |
| MJ Guptill | 68 | DA Warner (c) | 5 | |
| C Munro | 34 | DJM Short | 144 | |
| KS Williamson (c) | 50 | AC Agar | 110 | |
| MS Chapman | 337 | GJ Maxwell | 1 | |
| LRPL Taylor | 203 | AJ Finch | 28 | |
| C de Grandhomme | 95 | CA Lynn | 17 | |
| MJ Santner | 48 | MP Stoinis | 85 | |
| TL Seifert † | 469 | AT Carey | 218 | |
| TG Southee | 73 | AJ Tye | 30 | |
| IS Sodhi | 88 | KW Richardson | 131 | |
| TA Boult | 97 | B Stanlake | 166 | |
| Total | 1562 | Total | 935 | |
| Average | 142 | Average | 85 | |
| High | 34 | High | 1 | |
| Low | 469 | Low | 218 | |
| Top 10 | 0 | Top 10 | 2 | |
| Top 100 | 8 | Top 100 | 6 |
Players with the best winning %
The table below analyses the players with the highest win percentage over the last three years. Minimum qualification 50 matches played.
| Rating | Player | Played | Won | Won |
| 1 | HH Pandya | 64 | 44 | 68.8% |
| 2 | Mohammad Nabi | 88 | 59 | 67% |
| 3 | Rashid Khan | 80 | 52 | 65% |
| 4 | RG Sharma | 76 | 48 | 63.2% |
| 5 | Yuvraj Singh | 54 | 34 | 63% |
| 6 | F Behardien | 61 | 38 | 62.3% |
| 7 | JJ Bumrah | 66 | 41 | 62.1% |
| 8 | C Munro | 86 | 53 | 61.6% |
| 9 | S Dhawan | 67 | 41 | 61.2% |
| 10 | IS Sodhi | 64 | 39 | 60.9% |
| 11 | Imad Wasim | 63 | 38 | 60.3% |
| 12 | MK Pandey | 54 | 32 | 59.3% |
| 13 | AD Russell | 103 | 61 | 59.2% |
| 14 | CH Morris | 66 | 39 | 59.1% |
| 15 | MS Dhoni | 83 | 49 | 59% |
| 16 | KK Cooper | 58 | 34 | 58.6% |
| 17 | AJ Tye | 53 | 31 | 58.5% |
| 18 | MH Wessels | 53 | 31 | 58.5% |
| 19 | DA Warner | 60 | 35 | 58.3% |
| 20 | MC Henriques | 74 | 43 | 58.1% |
Players with the highest Strike-Rate
The table below analyses the players with the highest batting strike-rate. Minimum qualification 1000 runs.
| Player | Strike Rate | Runs | |
| 1 | AD Russell | 167.4 | 1872 |
| 2 | L Ronchi | 163.4 | 1698 |
| 3 | AB de Villiers | 162.9 | 2574 |
| 4 | Shahid Afridi | 162.1 | 1465 |
| 5 | AD Hales | 156.6 | 1115 |
| 6 | GJ Maxwell | 156.6 | 2006 |
| 7 | CH Gayle | 154.2 | 4260 |
| 8 | CA Lynn | 154.0 | 1854 |
| 9 | RE Levi | 153.2 | 1766 |
| 10 | E Lewis | 152.9 | 1980 |
Best Economy Rate
The table below analyses the players with the best economy rate. Minimum qualification 50 overs.
| Player | Economy Rate | Overs | |
| 1 | Rashid Khan | 5.86 | 311 |
| 2 | Yasir Shah | 6.06 | 90 |
| 3 | M Naveed | 6.06 | 83 |
| 4 | M Hafeez | 6.11 | 53 |
| 5 | SP Narine | 6.26 | 450 |
| 6 | Imad Wasim | 6.27 | 195 |
| 7 | R Clarke | 6.34 | 120 |
| 8 | Shadab Khan | 6.35 | 118 |
| 9 | Nazmul Islam | 6.39 | 73 |
| 10 | Sohag Gazi | 6.45 | 82 |
Highest Boundary Strike Rate
The table below analyses the players who score the highest % of their runs in boundaries (minimum qualification 1000 runs).
| Player | BSR % | Runs | |
| 1 | AD Hales | 26.0% | 1115 |
| 2 | AD Russell | 24.3% | 1872 |
| 3 | RE Levi | 24.2% | 1766 |
| 4 | PR Stirling | 23.7% | 1184 |
| 5 | CH Gayle | 23.5% | 4260 |
| 6 | L Ronchi | 23.4% | 1698 |
| 7 | E Lewis | 23.2% | 1980 |
| 8 | AB de Villiers | 22.8% | 2574 |
| 9 | BB McCullum | 22.4% | 3204 |
| 10 | JJ Roy | 22.3% | 1968 |
The Top 100 is made up of players from the following countries:
| Country | Number of players |
| India | 22 |
| Australia | 16 |
| New Zealand | 15 |
| England | 13 |
| Pakistan | 9 |
| South Africa | 8 |
| Trinidad | 5 |
| Bangladesh | 4 |
| Afghanistan | 2 |
| Barbados | 2 |
| Jamaica | 2 |
| Sri Lanka | 2 |
